
by Richard Warburton
2. Supercharge Your Microsoft Excel Data Cleaning with Python
Download the resources for this lesson here.
What Is Clean Data?
In our last lesson,What Does Clean Data Look Like in Microsoft Excel?, we introduced the concept of clean data. Clean data is the utopian state for all data analysis work as it requires no transformation prior to commencing analysis. We also introduced the Tidy Data Principals, which provides us with a framework for what this clean data should look like.
In this article, we will explore the process of cleaning data in Microsoft Excel; assess the options we have available to clean data; and demonstrate how we can use Python to carry out basic cleaning activities before analysing data in Excel.
What Is Data Cleaning?
Data cleaning is the process of taking messy data and transforming it into a clean data set that is ready for analysis.
When cleaning data, we need to explore each data set and determine the steps required to clean. We must call upon our knowledge and experience to determine what steps are needed and then implement the correct techniques to execute them.
When first exploring a new messy data set, it is likely that we will need to determine a new set of steps to clean the data. However, if we are dealing with a refreshed dataset we have explored before, it is possible previously defined steps will be repeatable.
What Are My Options for Cleaning Data in Excel?
There are three primary options for cleaning data in Excel. All have their pros and their cons.
- Manual Manipulation
- Power Query
- Python
Other options do exist. Visual Basic for Applications (VBA) was once the powerhouse of Excel and has been superseded by the Power suite of apps. Other coding languages such as R, are significantly more complicated for beginners to learn. These have not been considered here.
Manual Excel Manipulation
This is where most (if not all) people start out, however, you will quickly hit limitations and issues.
Initially, we manually process raw data into a clean format. We use formulas such as the TRIM function to remove blank spaces, or similar functions to convert the text in a cell into a new format; we may use the text to columns wizard to split data in the same column into multiple cells; and we may use lookups (such as VLOOKUP) to lookup values from one data set into another.
As our manual data cleaning skills progress, we may get used to using shortcut keys to quickly navigate all the cells in the spreadsheet. This speeds the whole process up, but it remains manual. If we are provided with an update of the file, one of the few situations where the same cleansing steps can probably be reapplied, then we must manually repeat all the steps.
Such a manual process is also prone to human error; with a chance for something to go wrong at every step. Unless we pick up on this, we may introduce errors into our data.
Manual data processing in excel is not recommended on a regular or repeatable basis. As a first step, it teaches us a lot about the process of cleaning data, however the manual overhead and the propensity for error means we need to find better ways of cleaning data.
Power Query
Power Query is a powerful tool and useful if you only ever clean data for analysis in Excel or for use in other Microsoft products such as PowerBI.
It provides an engine for extracting data from various sources, transforming it into the format needed and then loading it into an analysis tool. This process is often referred to as an ETL process.
Users can program a set of repeatable steps to cleanse data and then reapply them at the click of a button. A graphical user interface and easy to use wizards enable transformation steps to be implemented without a knowledge of the code it is producing in the background.
It is powerful! All manual Excel transformations can be completed in Power Query, and it introduces tools that Excel functions cannot complete. Such as file collation and merging datasets.
However, there are limitations. The M language it uses is counter intuitive and difficult to understand. Unless your process is particularly well annotated it is also exceptionally hard to follow others’ work (or understand your own after some time away from it). It can be slow for large data sets and tracking back through the code to find errors is a time-consuming task.
If you only ever want to transform data for use in the Microsoft suite of tools, then Power Query is a viable method for Cleaning Data. However, if you aspire to advanced analytics, data science, and machine learning, then it is not recommended.
Python
Using Python in conjunction with Excel to clean data opens significant opportunities for analysts. Complex (and repeatable) transformation processes can be implemented with a few lines of human readable code.
Python is a standalone programming language and is not proprietary to Microsoft. It is regularly listed as the top programming language for data science and is one of the best programming languages to learn as a beginner. It also has a range of preprogrammed libraries, which allow complex processes to be implemented with very little code.
Any data cleansing process that can be implemented manually or via Power Query can be replicated in Python.
There is a learning curve for Python and unlike Power Query, there is no friendly user interface to implement the code for us. However, opening a wider set of data tools for us to use, far outweighs the learning curve effort.
We strongly recommend learning to clean data contained within Microsoft Excel spreadsheets with Python. Something we will explore in more detail in the rest of this article.
How Do I Get Started with Python?
If you are new to Python, then there are two resources we recommend to get started.
Firstly, Pre-flight checks - Getting Started & Python Basics is a thorough instructor led course that will provide you with the foundations you need.
Secondly, Think Python (2nd Edition) by Allen B. Downey. This provides numerous worked examples and practice problems for you to solve.
For cleaning data, there are a few prerequisites you will need to understand:
- Basic Python syntax and operations
- Pandas and data frames (including indexing/slicing)
- Knowledge of data types (String, float, integer, dictionaries etc.)
- Executing Python script (in an IDE and/or notebook)
These two resources cover these topics in detail and provide you with the knowledge you need to get started.
How Do I Work with Excel and Python?
The process we will be using can be explained in three high level steps:
- Import data into Python from Excel.
- Carry out cleaning tasks in Python.
- Export data from Python back to Excel.
Within this, there are two best practice considerations.
- Within step 1, always take a copy of your original data and never work directly on the original.
- Within step 3, never overwrite the original data.
These are both focused on ensuring that we maintain our original data and can start the process again if we need.
The complexity in this process comes within step 2 where we need to determine what cleansing actions need to be applied and then implementing them in code.
Let’s explore this with an example.
Simple Example: Finding and Replacing Values
Consider a scenario where we want to understand the total volume and value of orders by customer. A very common ask if your business sells items directly to customers.
We go to our order system, and we extract data into Excel. We can see that the data is tidy in its format (see last article), however there is an issue with the Price Per Unit Value.

Messy data in Excel
It has several unnecessary characters which prevent Excel processing this as a number. Before we can complete the analysis, we need to clean and correct the data format for these values.
The files and code discussed in this example can be found in the lesson resources panel.
Step 1: Import Data to Python from Excel
Our first task is to import the data into Python for cleaning. To do this, we use the read_excel function from the Pandas library.
# Import packages required
import Pandas as pd

# Import messy data from Excel and assign to the mesy_data variabe as a data frame
messy_data = pd.read_excel('messy_order_data.xlsx', sheet_name='Sheet1')
This code imports the data from Sheet1 and stores it in a variable called messy_data as a data frame.
Step 2: Cary Our Cleaning Tasks in Python
The Process to Clean Data
By visually inspecting the data (either in the Excel spreadsheet or in Python) we can see that there are three cleansing tasks we need to complete.
- Remove the ‘,’ from the Price Per Unit Values
- Remove the ‘£---’ from the Price Per Unit Values
- Ensure the Values are numerical (not text)
The last step may not be an obvious one; however, by exploring the data type of the Price Per Unit Variable (a Pandas data series) after steps 1 and 2 (see supporting Jupyter Notebook), we can see it is an object. This will be treated as text when we export the data to Excel.
Code to Cleanse Data
The three cleaning steps above can be implemented with the following three lines of code. While it would be considered more ‘Pythonic’ to implement this with a single line of code, we have stepped through this one step at a time to help readers understand the process.
# Cleaning step 1: Remove ',' from the values and replace with ''
messy_data['Price Per Unit (£s)'] = messy_data['Price Per Unit (£s)'].str.replace(',','')

# Cleaning Step 2: Remove '£---' from the values and replace with ''
messy_data['Price Per Unit (£s)'] = messy_data['Price Per Unit (£s)'].str.replace('£---','')

# Cleaning Step 3: Coerce Price Per Unit to be a float
messy_data['Price Per Unit (£s)'] = messy_data['Price Per Unit (£s)'].astype(float)
Steps 1 and 2 use the str.replace function. This finds a predefined set of characters within the string value of a Pandas data series and replaces them with another. In this case, we use the replace function to find the string we wish to remove, (either ‘,’ or ‘£---‘) and replace with a null string (‘’).
Cleansing Step 3 uses the astype function to coerce the values to a float number type. The process of changing a variable type to a new one is called coercion. This can result in errors if Python does not know how to manage a value with the new data type. This example has been constructed to not have any coercion errors. However, you should check to confirm that this is the case when changing variable types.
For example, lets attempt to coerce the values in the Price Per Unit (£s) variable before carrying out cleaning steps 1 and 2. The first value in the data frame is:

A text string that looks like a numeric value
This string contains numeric vales (‘1054.63’) mixed with non-numeric characters (‘£---' and ‘,’). The existence of the latter in the string will prevent the coercion to a float value. Python does not know how to treat these as numbers and returns the following error as a result.

Example of coercion error
However, if these are removed and we apply the coercion to the string value ‘1054.63’, then Python can convert this to float.
Step 3: Export Data from Python Back to Excel
Our final task is to export the data back to Excel. We do this with the to_excel function.
# Export data back to excel
messy_data.to_excel('clean_order_data.xlsx',index=False)
To ensure we do not overwrite the raw messy data, we will export this with a new filename, passed in a string to the function as the first variable. By setting the index variable to False, Pandas won't export the indices to the Excel file with the data.
We now have data that has been cleansed and can be used for analysis.

Clean data in Excel
Analysis in Excel can quickly provide the requested information.
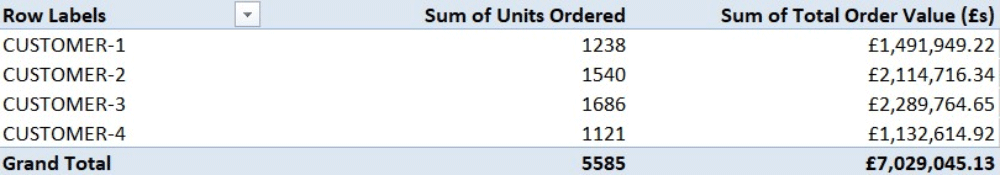
Excel pivot table analysis
Next Steps: Techniques to Learn
While this is a (relatively) simple example, it shows us that we can carry out complicated cleaning techniques in Python with a few lines of code.
In the next article, we will start to explore these new tools and demonstrate how to carry out more complicated tasks such as:
- Splitting one column of text values into separate columns based on a text delimiter.
- Removing duplicate data from the spreadsheet to ensure unique values.
- Combining variables and values from one or more columns with functions.
- Looking up values from one data source to another.
- Formatting and manipulating text format or values.