![[object Object]](/_next/image?url=https%3A%2F%2Fcdn.sanity.io%2Fimages%2Fei1axngy%2Fproduction%2Fd192001e06ed413fb0e091ac51bca29248130453-942x942.jpg&w=256&q=75)
by Dr Ana Rojo-Echeburúa
Updated 20 November 2023
Build an AI Data Assistant with Streamlit, LangChain and OpenAI
![[object Object]](/_next/image?url=https%3A%2F%2Fcdn.sanity.io%2Fimages%2Fei1axngy%2Fproduction%2Fbc8a0229f307e2800f94b01228adc5b4f0ea8aa2-1024x474.jpg&w=2048&q=75)
Download the resources for this post here.
AI Assistants are everywhere these days, making our lives easier, and OpenAI has been at the forefront of this exciting trend.
In this series, we are developing an AI assistant using Streamlit and LangChain, designed to help you with your data science projects. This AI assistant will streamline the entire process of a data science project, including EDA, model selection and prediction and more.
📌 A significant savings in both time and resources.
This series will be split in three parts:
| EDA | Model Selection and Prediction | App Enhancement and Chatbox |
|---|---|---|
| Introduction to Streamlit, LLMs and Langchain agents | Langchain Chains, Tools and More Agents | Memory, Indexes and Deployment |
In this first part of this series, we are building an AI-powered assistant that will transform the way you explore and analyse data.
Say goodbye to complex data analysis processes and hello to a more intuitive and interactive experience!
✨What you learn here can be applied to ✨
For example, you might want to create an assistant to help you explore sales data or customer reviews. While we'll focus on one specific use case, you can easily adapt these techniques to your unique needs!
🔗 We will be using the following use case.
🧠 Key learnings
Streamlit:
- Structuring elements like titles, headings, subheadings, captions, and text formatting
- Implementing dividers
- Uploading CSV files
- Implementing a sidebar for enhanced user interaction
- Utilising expanders for collapsible content sections
- Displaying graphs for data visualisation
- Implementing text input features
- Exploring the concept of caching
- Discussion of session state and implementation of non-stateful buttons
OpenAI and LangChain:
- Configuration of an OpenAI Key
- Loading and using OpenAI LLMs to generate information
- Using Pandas agent to:
- Answer specific predefined questions about a dataframe
- Answer specific predefined questions about a variable chosen by the user
- Answer specific questions chosen by the user
✏️ Knowledge prerequisites
To make the most of this series, it's beneficial to have some foundational knowledge in data science and Python:
- Basic data science concepts: Familiarity with concepts such as data frames, data cleaning, data summarisation, and data visualisation will be advantageous. This tool is designed to be user-friendly and informative, so it's suitable for both beginners and experienced data scientists.
- Python programming: A basic understanding of Python is essential. You don't need to be a Python expert, but some knowledge of Python syntax and data manipulation will help you navigate and customise the script.
- Statistical understanding: A basic grasp of statistical concepts like mean, median, mode, standard deviation, and correlation will be useful when interpreting the results of the EDA.
Remember, our AI Assistant is here to guide you through the process, so even if you're a beginner, you can learn as you go!
This project is an excellent opportunity to gain hands-on experience in data science and make informed decisions based on your data.
💻 Streamlit
Streamlit is a powerful and user-friendly Python library that plays a central role in this project. It serves as the backbone for our AI Assistant for Data Science. Streamlit is designed to simplify the process of creating interactive web applications with minimal code.

Figure 1. Streamlit
At its core, Streamlit allows you to turn data scripts into shareable web apps with ease. It's an open-source framework that eliminates the need for extensive web development skills, allowing users to focus on their data and analysis instead of worrying about web application complexities.
Some key features of Streamlit are:
- Rapid prototyping: Streamlit is known for its rapid prototyping capabilities. With just a few lines of Python code, you can turn your scripts into functional web applications.
- Interactive elements: Streamlit provides a variety of interactive elements, including sliders, buttons, and text inputs, allowing users to interact with data visualisations and explore different scenarios.
- Data integration: Streamlit seamlessly integrates with popular data science libraries like Pandas and Matplotlib, making it a versatile choice for data analysis and visualisation tasks.
- Customisation: While Streamlit is beginner-friendly, it also offers customisation options for those who want to create more sophisticated applications. You can incorporate custom CSS, JavaScript, and widgets as needed.
- Deployment: Streamlit makes it easy to deploy your web apps to the cloud or share them with others, further enhancing its utility for collaborative data projects.
In this project, Streamlit is the foundation for the user interface, allowing you to upload CSV files, visualise data, and interact with the AI Assistant seamlessly.
🔗 Visit Streamlit official website here.
⚙️ OpenAI and LLMs
OpenAI has made significant strides in natural language processing and machine learning. One of their groundbreaking contributions to the field is Large Language Models (LLMs). These models have the capability to understand, generate, and analyse human language on a massive scale.

Figure 2. OpenAI
Key aspects of LLMs are:
- Language understanding: LLMs have been trained on extensive text corpora, enabling them to understand and interpret a wide range of human languages. They can comprehend and respond to text input, making them ideal for natural language interfaces.
- Language generation: These models have the ability to generate human-like text, making them valuable for providing explanations, answering questions, and even suggesting data science methodologies.
- Customisation: They can be fine-tuned for specific tasks and domains, which is particularly advantageous in tailoring their responses to your data science needs.
In this project, LLMs are integrated into the Streamlit application, allowing you to have dynamic, real-time interactions with the AI Assistant. We will be using OpenAI's GPT 3.5-Turbo model but you can experiment using other models. You can ask questions, seek explanations, and receive immediate responses.
🔗 Visit OpenAI official website here.
⛓️ LangChain
Langchain is a framework that can be used to build conversational AI systems that can understand and respond to user queries, making it a valuable tool for AI chatbots and virtual assistants.

Figure 3. Langchain
Its core strengths lie in its data-awareness and agentic capabilities, making it exceptionally adept at handling extensive datasets and offering efficient query functionality.
Its main components are: models, agents, tools, prompt templates, chains, memory and indexes.
- Models: LangChain incorporates a versatile array of models for natural language processing. These are instrumental in processing unstructured text data and facilitating information retrieval based on user queries.
- Agents: They are responsible for interfacing with user inputs and employing different models to process them. Agents play a pivotal role in determining the actions to be taken and their order. Agents can be strung together to create more intricate and sophisticated applications.
- Tools: These have functionalities that agents use to engage with their environment. These resources can take the form of versatile utilities (such as search capabilities), chains or even other agents.
- Prompt templates: These provide the means to build prompts for user inquiries, which can subsequently be passed to LLMs for processing.
- Chains: These are sequences of models that work cohesively to achieve specific objectives.
- Indexes: LangChain's indexing functionality is pivotal in organising documents in a manner that enables LLMs to swiftly extract information in response to user queries.
- Memory: The memory components empower applications like chatbots to recall past interactions, thereby delivering personalised responses to users, even for similar queries.
In this project, we will be using the Pandas agent in conjuntion with the LLM model to answer exploratory analysis questions.
🔗 Visit LangChain documentation here.
🔑 Installation requirements and setup
Before you can start using our AI Assistant for Data Science, you'll need to ensure that your environment is properly set up.
Install Dependencies
Our AI Assistant relies on several Python packages and libraries. You can install them using pip and the requirements.txt file included in this project, writing the following command in the terminal.
pip install -r requirements.txt
This command will install all the necessary packages.
Set Up OpenAI API Key
For our AI Assistant to interact with OpenAI's LLM, you need to provide your OpenAI API key.
First, you will need an OpenAI account here. Then, you wil need to generate a key here.
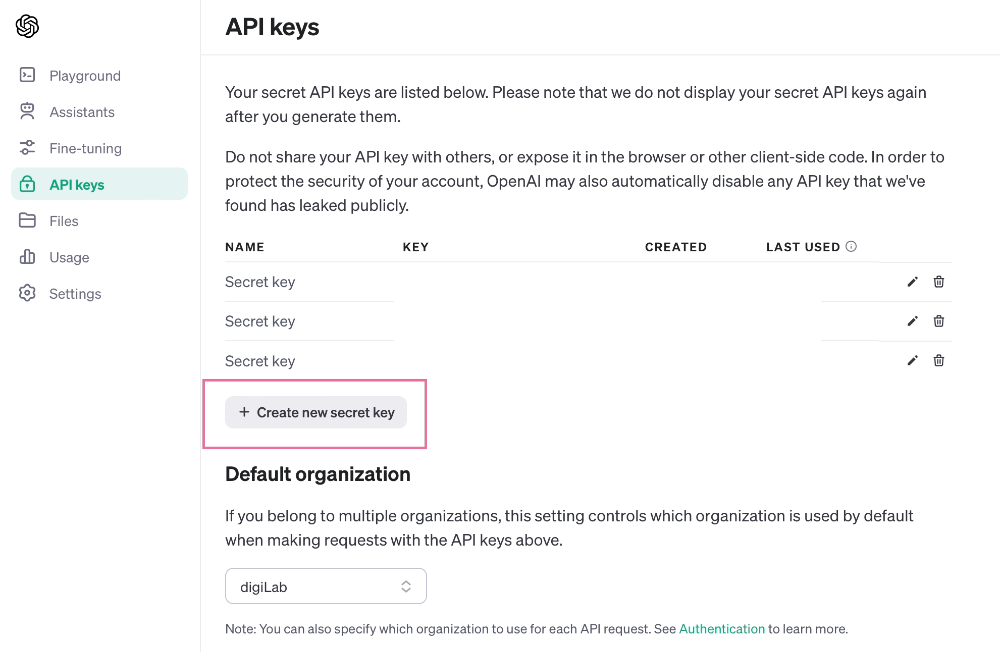
Figure 4. API key
In order to set up this key in your script, first you will need to create a new file in your working directory and store your key there:
apikey = "your_openai_api_key_here"
Run the Streamlit App
With the environment set up and the API key in place, you can now run the Streamlit application. In the terminal, use the following command:
streamlit run [your_script_name.py]
👉 Replace your_script_name.py with the name of your Streamlit Python script.
📦 Importing required packages
Before we dive into the code of our AI Assistant, it's important to understand the Python packages and modules we'll be using. These packages provide the necessary functionality for our project.
import os
from apikey import apikey

import streamlit as st
import pandas as pd

from langchain.llms import OpenAI
from langchain.agents import create_pandas_dataframe_agent
from dotenv import load_dotenv, find_dotenv
Let's take a closer look at what each of them does:
- os: This library provides a way of using operating system-dependent functionality. In our script, we use it to set environment variables, such as the OpenAI API key, to enable secure communication with OpenAI's language model.
- apikey: We import the apikey module, which contains your OpenAI API key. This key is required to authenticate with the OpenAI API.
- streamlit: Streamlit is at the heart of our project. It allows us to create a user-friendly interface for our AI Assistant.
- pandas: The pandas library is a fundamental tool for data manipulation and analysis. We use it to handle the dataset that users upload, making it easy to perform data exploration.
- langchain.llms: This module from the langchain package is specific to our project and incorporates OpenAI's Large Language Models. It allows us to interact with the language model for natural language understanding and generation.
- langchain.agents: Another module from langchain, is used to create a Pandas DataFrame agent. This agent helps us bridge the gap between data manipulation and natural language interaction.
- dotenv: This library is used to load environment variables from a .env file. It ensures that sensitive information, such as your OpenAI API key, is securely stored and accessed.
Importing these packages and modules allows us to equip our AI Assistant with the necessary tools to make data science accessible and engaging. In the following sections, we'll explore how these components come together to create a dynamic and interactive experience for data analysis.
🗝️ Setting openAI key
To make your API key accessible to the script, you need to set it as an environment variable. In our code, we use the os module to achieve this:
os.environ['OPENAI_API_KEY'] = apikey
This ensures that your API key is properly configured for communication with OpenAI's LLM.
With your OpenAI API key securely stored and set, your AI Assistant is ready to utilise the capabilities of the LLM to interact with you in natural language, answer questions, and assist with data analysis. This secure setup ensures that your data and interactions remain private and protected.
📕 Adding a title and an introduction
Your AI Assistant for Data Science should have a welcoming and informative user interface.
In this subsection, we'll cover how to set up the title and an introductory message for your Streamlit application.
To give your AI Assistant a title, you can use the st.title() function provided by Streamlit. This function displays a large, bold title at the top of the web application. You can set the title as follows:
st.title('AI Assistant for Data Science 🤖')
After setting the title, it's essential to provide an introductory message that informs users about the purpose and capabilities of your AI Assistant. This message should make users feel welcome and comfortable using the application. In your script, you can use the st.write() function to display the introduction:
st.write("Hello 👋🏻 I am your AI Assistant, and I am here to help you with your data science problems.")
The st.write() function allows you to include text that provides context and sets the stage for the user's interaction with the AI Assistant.
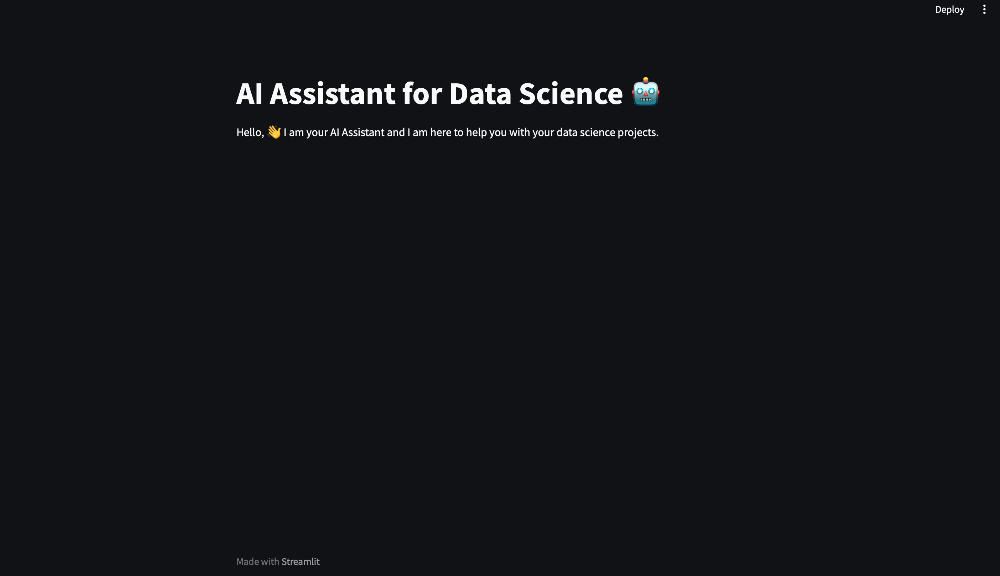
Figure 5. Title and Intro
🗒️ Adding headers and subheaders
Streamlit also allows you to add headers and subheaders to your applications.
In this subsection, we'll cover how to add headers and subheaders in your Streamlit application.
st.header("Exploratory data analysis")
st.subheader("General information about the dataset")

Figure 6. Headers and Subheaders
Adding a title, header, subheaders and an introduction creates a user-friendly and engaging environment. Users will know exactly what to expect and feel more at ease as they begin their data science journey with your AI Assistant.
💾 Text formatting
Streamlit offers text formatting options to make your content more engaging and informative. You can apply formatting to text using Markdown.
In this subsection, we will cover basic text formatting and how to implement HTML.
Here are some examples of basic text formatting:
- Bold Text: To make text bold, use double asterisks (
**) or double underscores (__) around the text.
st.write("This is **bold** text.")
- Italics Text: To make text italic, use single asterisks (
*) or single underscores (_) around the text.
st.write("This is *italic* text.")
- Bullet Lists: Create bullet lists using
*or-followed by the list items.
st.write("Here's a list:\n* Item 1\n* Item 2\n* Item 3")
Streamlit also allows you to customise your text using HTML but using the unsafe_allow_html=True parameter. For example, this is how you would centre a caption in the sidebar:
st.caption('<p style="text-align:center">made with ❤️ by Ana</p>', unsafe_allow_html=True)
These text formatting options allow you to structure and emphasise important information within your AI Assistant.
👩🏫 Adding an explanation sidebar
An explanation sidebar is a valuable component of your Streamlit application that can provide users with additional context and guidance.
In this subsection, we'll cover how to create and set up an explanation sidebar for your AI Assistant.
Streamlit provides an st.sidebar context manager that allows you to add content specifically to the sidebar of your application. In your script, you can use this context manager to create the explanation sidebar:
with st.sidebar:
    st.write("*Your Data Science Adventure Begins with a CSV Upload*")
    st.caption('''You may already know that every exciting data science journey starts with a dataset. That's why I'd love for you to upload a CSV file. Once we have your data in hand, we'll dive into understanding it and have some fun exploring it. Then, we'll work together to shape your business challenge into a data science framework. I'll introduce you to the coolest machine learning models, and we'll use them to tackle your problem. Sounds fun right?''')
The code above uses st.write() and st.caption() to add text and captions to the sidebar. You can customise this content to provide information about the AI Assistant's purpose and the steps users should take.
This will enhance the user experience by providing clear instructions and guidance on how to get started with your AI Assistant. Users will appreciate the additional context and feel more confident as they embark on their data science adventure.
✂️ Adding a divider
Dividers are useful for visually separating different sections of your application, making it easier for users to navigate.
In this subsection, we'll explore how to enhance the visual presentation of your AI Assistant by adding dividers.
You can use the st.divider() function to insert a horizontal line. Here's how to add a divider in your script:
st.divider()
You can place dividers between various sections of your AI Assistant to create a clean and organised interface.
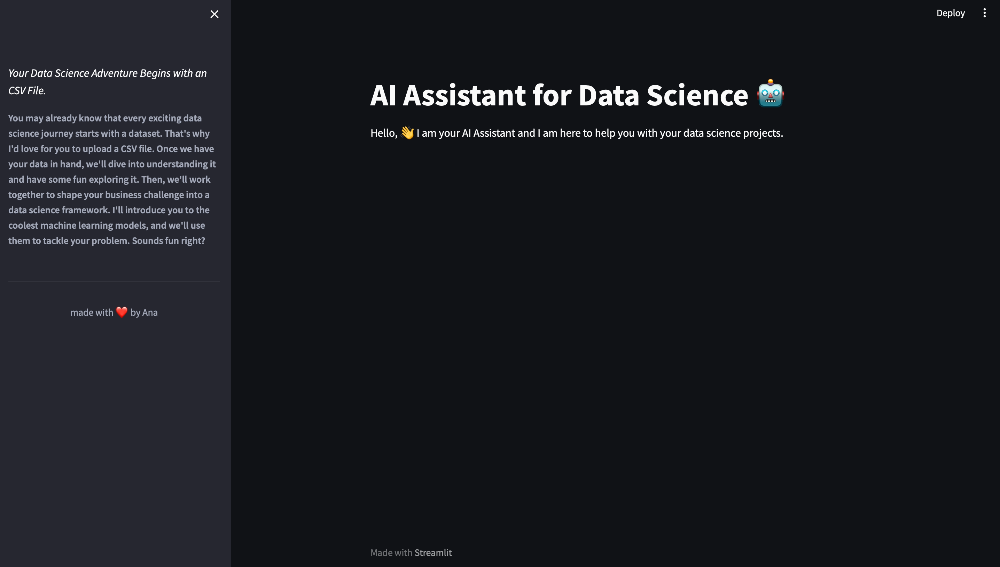
Figure 7. Divider
Adding dividers and applying text formatting, allows you to create a visually appealing and well-organised interface for your AI Assistant. This not only enhances the user experience but also makes your content more accessible and engaging.
🖲️ Adding a button and session state in Streamlit
Buttons are a common way to trigger actions or transitions in a Streamlit application.
In this subsection, we'll explore how to add an interactive button and manage session state in your Streamlit application.
These elements allow users to initiate specific actions and maintain information between interactions.
You can use st.button() to create a button element:
if st.button("Let's get started"):
    # Action to perform when the button is clicked
However, buttons return True only momentarily, during the page load immediately after they're clicked, and then revert to False. To work around this, Streamlit allows you to manage session state, which is essential for maintaining information and interactions between different sections of your application. In your script, you can use the st.session_state object to create and manage session state variables:
# Initialise a session state variable
if 'clicked' not in st.session_state:
    st.session_state.clicked = {1: False}

# Function to update the value in session state
def clicked(button):
    st.session_state.clicked[button] = True

# Button with callback function
if st.button("Let's get started", on_click=clicked, args=[1]):
    # Action to perform when the button is clicked
In the code above, we initialise a session state variable named clicked and update it when the button is clicked. This allows you to maintain information and conditions across different parts of your application.
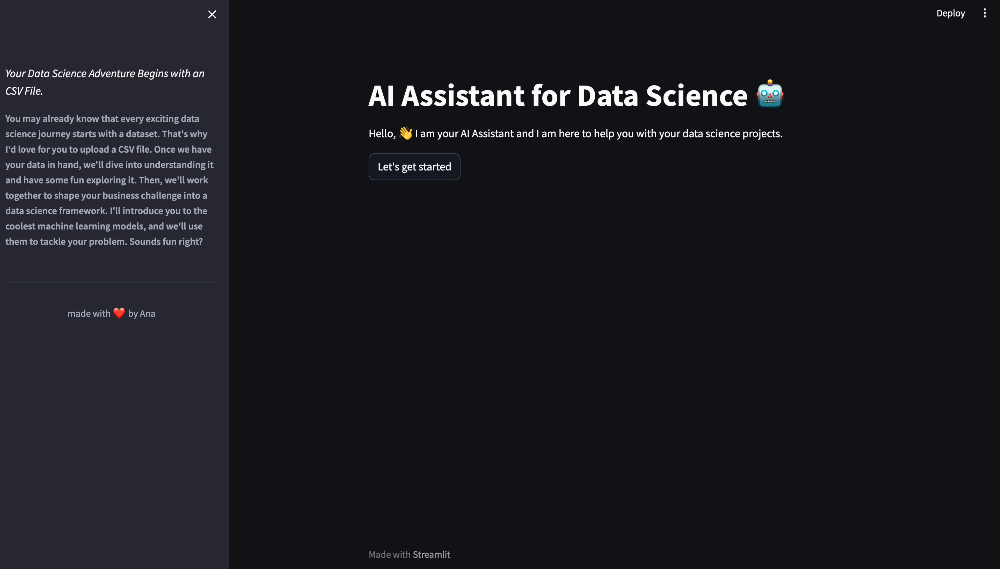
Figure 8. Button
Buttons can trigger specific actions, and session state helps maintain a coherent state of the application throughout the user's interaction. This will create an interactive and dynamic experience for users.
📁 Add a file uploader
The file uploader is a crucial feature that enables users to upload their own CSV files, which can then be used for data analysis and exploration.
In this section, we'll walk through how to add a file uploader to your Streamlit application.
Streamlit provides a convenient function called st.file_uploader() for adding file upload functionality. Here's how you can incorporate it into your script:
user_csv = st.file_uploader("Upload your file here!", type="csv")
The st.file_uploader() function accepts a label as its first argument (in this case, "Upload your file here!") and an optional type parameter to specify the accepted file format. We've set it to "csv" to ensure that users can only upload CSV files.

Figure 9. File Uploader
Once a user uploads a file, the user_csv variable will contain the uploaded file data.
🪞 Converting our .csv file into a dataframe
Now that users can upload their CSV files, it's time to convert the uploaded file into a Pandas DataFrame, which is the standard data structure for data manipulation and analysis in Python.
In the subsection, we will cover how to tranform our CSV file into a Pandas dataframe
In order to do this, we can use the following code:
if user_csv is not None:
    user_csv.seek(0)
    df = pd.read_csv(user_csv, low_memory=False)
In the code above, we first ensure that the file pointer is at the start of the file (in case it was used elsewhere). Then, we read the CSV file into a Pandas dataframe named df.
Setting low_memory=False means that Pandas will not optimise memory usage when reading the CSV file. By default, pandas uses a memory-saving mode that reads data in chunks, attempting to minimise memory consumption. However, setting low_memory=False disables this memory-saving mode, and Pandas will load the entire dataset into memory at once.
This dataFrame is now ready for analysis and exploration.
🔋 Loading our LLM model
Our AI Assistant relies on a Large Language Model (LLM) to provide natural language understanding and generate responses.
In this subsection, we'll cover how to load and initialise the LLM model for your Streamlit application.
We use the OpenAI LLM model to interact with users:
llm = OpenAI(temperature=0)
In this code, we create an instance of the model named llm. The temperature parameter controls the randomness of the LLM's responses, with a value of 0 making the responses deterministic in this case. The higher the temperature, the more creative the model is.
The LLM model is a crucial component of your AI Assistant, allowing it to communicate and interact with users in a conversational manner. It enables your assistant to provide insightful and informative responses in a natural language format.
📢 Using our LLM to generate information
With the LLM initialised, your AI Assistant can now understand user queries, generate natural language responses, and assist with data analysis.
In this subsection, we will use our LLM model to generate information.
In order to generate information, we can use our LLM model in this way:
steps_eda = llm("What steps are involved in EDA?")
In the code above, the LLM is presented with a question, and it generates a response that provides information and explanations, in this case, about the steps that are involved in Exploratory Data Analysis. This information is saved in the variable steps_eda.
🪗 Adding expanders to the sidebar
Expanders are a valuable Streamlit feature that allows you to organise content and provide users with the option to reveal or hide additional information in the sidebar of your Streamlit application.
In this subsection, we'll explore how to add expanders to enhance the user experience.
Streamlit makes it easy to create expanders using the st.expander() function. We can use expanders in the sidebar in order to show information about the EDA steps:
with st.sidebar:
    with st.expander("What steps are involved in EDA?"):
        st.caption(steps_eda())

Figure 10. Expander 1
This is an expander.
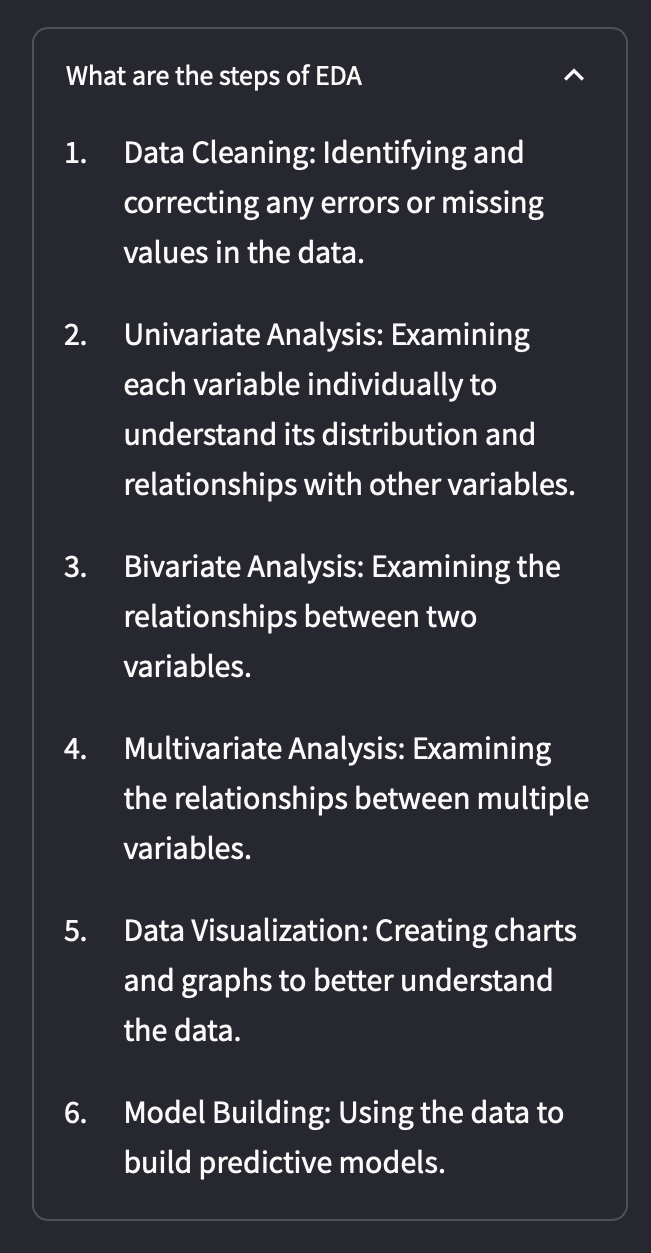
Figure 11. Expander 2
The user has the option to expand the information by clicking the arrow.
Expanders are excellent for organising and structuring information.The collapsible nature of expanders keeps the interface clean and user-friendly.
🕵️ Create a Pandas agent
LangChain's Pandas Agent serves as a valuable tool tailored for the efficient handling of datasets. It seamlessly interacts with Pandas data frames, offering advanced querying capabilities. With a suite of key features, it excels in grouping, aggregating, applying intricate filtering conditions, and seamlessly joining multiple data frames. This agent caters to the needs of developers dealing with extensive datasets, seeking advanced query and data manipulation functionality.
In this subsection, we'll cover how to create a Pandas agent and enable it to analyse and provide insights about the data.
First, you need to create an instance of the Pandas agent by passing your LLM model and the DataFrame you want to analyse:
pandas_agent = create_pandas_dataframe_agent(llm, df, verbose=True)
In this code we create a Pandas agent named pandas_agent by calling create_pandas_dataframe_agent() and passing the LLM and the dataframe df we previously converted from the uploaded CSV file.
Your Pandas agent can now perform various data analysis tasks. You can define functions that correspond to common data analysis operations, and your agent can provide answers and insights based on user queries. For example, you can create functions to:
- Explain the meaning of columns in the dataframe.
- Calculate summary statistics like mean, median, and standard deviation.
- Identify missing values and duplicates.
- Conduct correlation analysis, outlier detection, and more.
📉 Using Pandas agent to answer specific questions about the data
With your Pandas agent ready, you can now use it to answer specific questions and provide insights about the data.
In this subsection, we'll explore how to interact with the Pandas agent to obtain information and perform data analysis tasks.
The Pandas agent is designed to understand and respond to queries about the DataFrame. Here's an example of how you can use the Pandas agent to answer questions:
question = "What are the meanings of the columns?"
columns_meaning = agent.run(question)
st.write(columns_meaning)
In the code above, the Pandas agent processes the query and generates a response, which is then displayed to the user using st.write().
For our AI assistant, we are going to create a function that will perform Exploratory Data Analysis to our dataset:
def function_agent():
    st.write("**Data Overview**")
    st.write("The first rows of your dataset look like this:")
    st.write(df.head())
    st.write("**Data Cleaning**")
    columns_df = pandas_agent.run("What are the meaning of the columns?")
    st.write(columns_df)
    missing_values = pandas_agent.run("How many missing values does this dataframe have? Start the answer with 'There are'")
    st.write(missing_values)
    duplicates = pandas_agent.run("Are there any duplicate values and if so where?")
    st.write(duplicates)
    st.write("**Data Summarisation**")
    st.write(df.describe())
    correlation_analysis = pandas_agent.run("Calculate correlations between numerical variables to identify potential relationships.")
    st.write(correlation_analysis)
    outliers = pandas_agent.run("Identify outliers in the data that may be erroneous or that may have a significant impact on the analysis.")
    st.write(outliers)
    new_features = pandas_agent.run("What new features would be interesting to create?.")
    st.write(new_features)
    return
The function_agent function is designed to provide a structured overview of a dataset and perform various data-related tasks using a Pandas agent.
st.write("**Data Overview**"):This line displays a section header, "Data Overview," using Streamlit'sst.write()function. It's used to introduce the first section of the data analysis process.st.write("The first rows of your dataset look like this:"):This line provides a description to inform the user that they will see the initial rows of the dataset.st.write(df.head()):Here,df.head()is used to display the first few rows of the dataset stored in the variable df. This is a typical way to show the initial structure and contents of the dataset.st.write("**Data Cleaning**"):Similar to step 1, this line introduces a new section, "Data Cleaning."columns_df = pandas_agent.run("What are the meaning of the columns?"):In this line, a question is posed to the Pandas agent using the pandas_agent.run function. The agent is asked to explain the meaning of the dataset's columns, and the response is stored in thecolumns_dfvariable.st.write(columns_df):The response obtained from the Pandas agent in the previous step is displayed usingst.write(). This can include explanations of the columns' content or metadata.missing_values = pandas_agent.run("How many missing values does this dataframe have? Start the answer with 'There are'"):This time, the Pandas agent is asked to count the missing values in the dataset and return a response that starts with "There are."st.write(missing_values):The count of missing values obtained from the Pandas agent is displayed.duplicates = pandas_agent.run("Are there any duplicate values and if so where?"):Here, the Pandas agent is tasked with identifying and specifying the location of any duplicate values in the dataset.st.write(duplicates):The response from the Pandas agent regarding duplicates is displayed.st.write("**Data Summarisation**"):This line introduces a new section, "Data Summarisation."st.write(df.describe()):Thedescribemethod is used to generate summary statistics for the dataset. This line displays those statistics to give an overview of numerical data characteristics.correlation_analysis = pandas_agent.run("Calculate correlations between numerical variables to identify potential relationships."):The Pandas agent is asked to perform correlation analysis between numerical variables in the dataset to identify potential relationships.st.write(correlation_analysis):The results of the correlation analysis are displayed.outliers = pandas_agent.run("Identify outliers in the data that may be erroneous or that may have a significant impact on the analysis."):The Pandas agent is tasked with identifying and providing information about outliers in the dataset.st.write(outliers):The response regarding outliers from the Pandas agent is displayed.new_features = pandas_agent.run("What new features would be interesting to create?."):The Pandas agent is asked to suggest new features that might be interesting to create based on the dataset.st.write(new_features):The suggested new features are displayed.
This function essentially guides the user through various data analysis tasks, using the Pandas agent to provide insights and perform specific data-related operations on the dataset. It organises the process into distinct sections and provides explanations and results to the user.
In order to display the answers of this function taking into account user experience, we can write the following code:
st.header('Exploratory data analysis')
st.subheader('General information about the dataset')
function_agent()
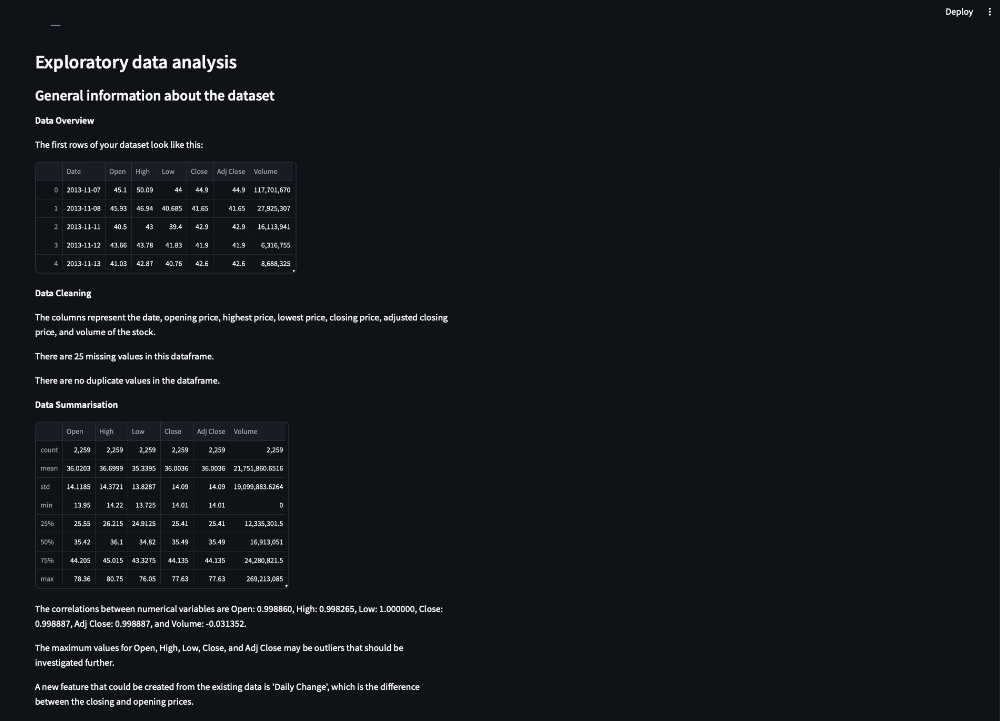
Figure 12. Exploratory Data Analysis
🗞️ Caching in Streamlit
Caching is an important feature in Streamlit that allows you to store and reuse the results of functions. This significantly improves the performance and responsiveness of your AI Assistant. In this subsection, we'll explore how to use caching in Streamlit for your functions.
Streamlit provides the @st.cache_data decorator, which you can apply to functions you want to cache.
@st.cache_data
def your_function():
    #what your function does
    return
In our script for our AI Assistant, we will cache all our functions to avoid them to be rerun. When you call the function with the same input parameters in the future, Streamlit will use the cached result instead of re-computing it.
Caching helps reduce computation time and ensures a smooth user experience, especially when dealing with functions that involve data processing or retrieval.
📈 Using Streamlit data visualisation features
Data visualisation is a crucial aspect of data analysis and presentation. Streamlit offers a range of data visualisation features that allow you to create interactive charts, plots, and visual representations of data in your AI Assistant.
In this subsection, we'll explore how to use Streamlit's data visualisation capabilities.
Streamlit supports various charting libraries, such as Matplotlib, Plotly, and Altair. You can use these libraries to create interactive charts like line plots, bar charts, scatter plots, and more. You can customise the chart's appearance and interactivity to best convey the insights you want to share with your users.
Interactive widgets like sliders, buttons, and text inputs can be used in conjunction with visualisations to allow users to adjust parameters, apply filters, and explore data interactively.
📡 Use Pandas agent to answer specific predefined questions about a variable chosen by the user
One of the powerful capabilities of your AI Assistant is its ability to answer specific questions about a variable chosen by the user. The Pandas agent, in conjunction with Streamlit, makes this interaction informative and user-friendly.
In this subsection, we'll explore how our assistant handles predefined questions about user-selected variables.
We can use text_input() to allow users to select a variable from the dataset that they want to explore further:
user_question_variable = st.text_input("What variable are you interested in?")
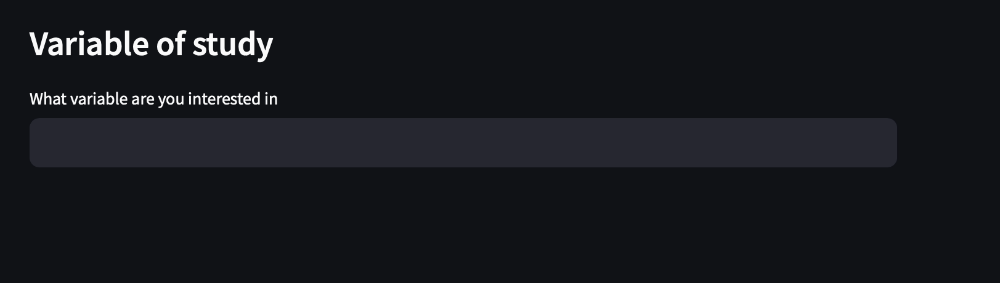
Figure 13. User Question Variable
With the user-selected variable in hand, our Pandas agent can take over to answer specific questions about the variable.
The function_question_variable function is focused on conducting various data analysis tasks and summarising information related to a specific variable of interest in a dataset.
def function_question_variable():
st.line_chart(df, y = [user_question_variable])
summary_statistics = pandas_agent.run(f"What are the mean, median, mode, standard deviation, variance, range, quartiles, skewness and kurtosis of {user_question_variable}")
st.write(summary_statistics)
normality = pandas_agent.run(f"Check for normality or specific distribution shapes of {user_question_variable}")
st.write(normality)
outliers = pandas_agent.run(f"Assess the presence of outliers of {user_question_variable}")
st.write(outliers)
trends = pandas_agent.run(f"Analyse trends, seasonality, and cyclic patterns of {user_question_variable}")
st.write(trends)
missing_values = pandas_agent.run(f"Determine the extent of missing values of {user_question_variable}")
st.write(missing_values)
return
st.line_chart(df, y=[user_question_variable]):This line generates a line chart using the Streamlitst.line_chart()function. The chart visualises the data in the df dataset, specifically for the variable indicated byuser_question_variable.summary_statistics = pandas_agent.run(f"What are the mean, median, mode, standard deviation, variance, range, quartiles, skewness, and kurtosis of {user_question_variable}"):The Pandas agent is instructed to compute and provide summary statistics for the variable specified inuser_question_variable.st.write(summary_statistics):The summary statistics obtained from the Pandas agent are displayed using the st.write function. This presents a concise overview of the variable's characteristics.normality = pandas_agent.run(f"Check for normality or specific distribution shapes of {user_question_variable}"):The Pandas agent is tasked with assessing the normality of the distribution or identifying specific distribution shapes for the variable in question. This information is stored in thenormalityvariable.st.write(normality):The results of the normality assessment are presented to the user through thest.write()function.outliers = pandas_agent.run(f"Assess the presence of outliers of {user_question_variable}"):The Pandas agent is instructed to evaluate the presence of outliers within the specified variable.st.write(outliers):The outcomes of the outlier assessment, provided by the Pandas agent, are displayed.trends = pandas_agent.run(f"Analyse trends, seasonality, and cyclic patterns of {user_question_variable}"):The Pandas agent is requested to analyse trends, seasonality, and cyclic patterns related to the variable represented byuser_question_variable.st.write(trends):The results of the trend, seasonality, and cyclic pattern analysis are presented to the user.missing_values = pandas_agent.run(f"Determine the extent of missing values of {user_question_variable}"):The Pandas agent is employed to determine the extent of missing values within the specific variable.st.write(missing_values):The information about the presence and extent of missing values, as provided by the Pandas agent, is displayed.
This function offers a comprehensive analysis of a chosen variable, ranging from basic visualisation to summary statistics, distribution assessments, outlier detection, trend analysis, and missing value evaluation. It allows users to gain deeper insights into the variable's characteristics and behaviour within the dataset.
In order to store the user variable and to display the answer, we can write the following code, using text inputs:
user_question_variable = st.text_input('What variable are you interested in')
if user_question_variable is not None and user_question_variable !="":
    function_question_variable()
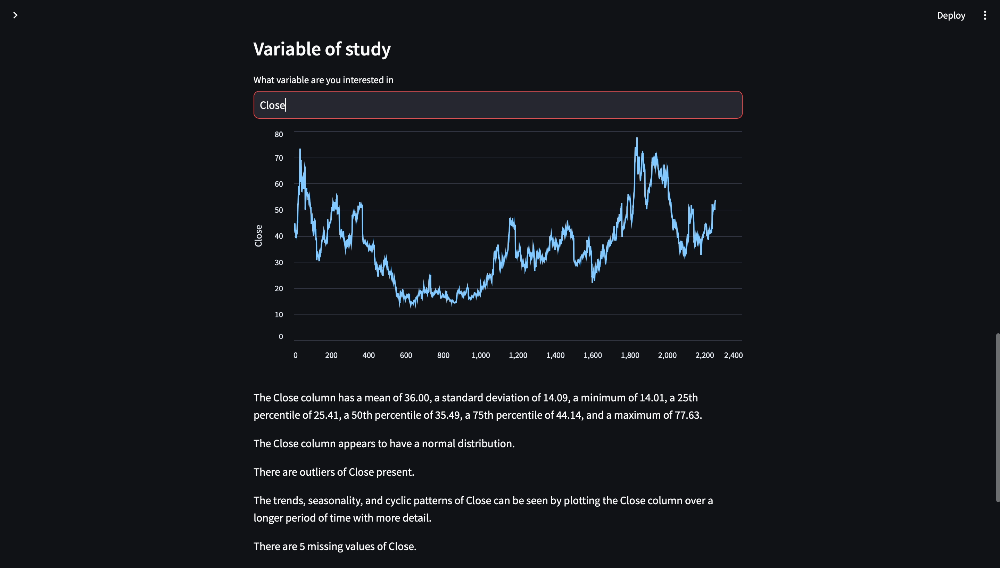
Figure 14. User Question Variable Output
🐼 Use Pandas agent to answer specific questions chosen by the user
In addition to predefined questions, we can enable our AI Assistant to have the capability to answer custom questions posed by the user. This flexibility allows users to inquire about specific aspects of the data that matter most to them.
In this subsection, we'll explore how our assistant can interact with users and provides tailored responses to their questions.
Users might want to ask any questions about the data that are relevant to their analysis.
- "What is the correlation between two specific variables?"
- "Are there any missing values in the dataset?"
- "Can you summarise the data for a variable in a specific time range?"
These questions are not predefined but can be asked on-the-fly, making the AI Assistant highly adaptable to user needs.
When a user asks a custom question, we can enable our AI Assistant to be able to direct the inquiry to the Pandas agent. The agent will process the question and will perform the necessary data analysis tasks to generate a meaningful response. For instance, if a user asks, "What is the correlation between 'variable A' and 'variable B'?", the Pandas agent will calculate the correlation coefficient and delivers an informative response.
This feature makes our AI Assistant a versatile and user-centric tool for data analysis. It adapts to the unique queries and requirements of individual users, empowering them to interact with data and derive insights that are important to their analysis.
The function_question_dataframe function in our script is designed to provide users with the ability to ask specific questions about the entire dataframe and receive responses using a Pandas agent.
def function_question_dataframe():
dataframe_info = pandas_agent.run(user_question_dataframe)
st.write(dataframe_info)
return
dataframe_info = pandas_agent.run(user_question_dataframe):This line sends the user-provided question or request, stored in the variable user_question_dataframe, to the Pandas agent. Then the Pandas agent processes this question.st.write(dataframe_info):The response generated by the Pandas agent, which answers the user's question, is displayed to the user.
The function_question_dataframe function acts as a user-friendly interface for making inquiries about the entire dataframe and obtaining informative responses based on the user's specific data exploration and analysis needs.
In order to store the user question and to display the answer, we can write the following code, using text inputs:
 if user_question_variable:
    user_question_dataframe = st.text_input( "Is there anything else you would like to know about your dataframe?")
        if user_question_dataframe is not None and user_question_dataframe not in ("","no","No"):
            function_question_dataframe()
        if user_question_dataframe in ("no", "No"):
            st.write("")
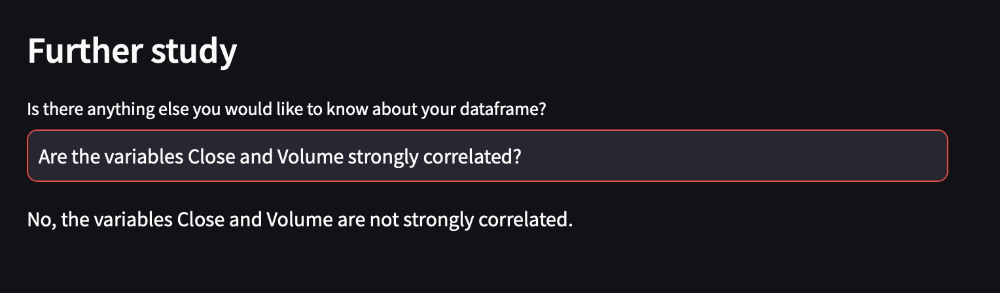
Figure 15. Answering Specific Questions
💭 Script train of thought
One notable feature of the LangChain framework is its ability to provide visibility into the thought process of our scripts during execution. This allows us to gain insights into how the agent reaches its conclusions and produces results, revealing the specific calculations undertaken to derive these outcomes.
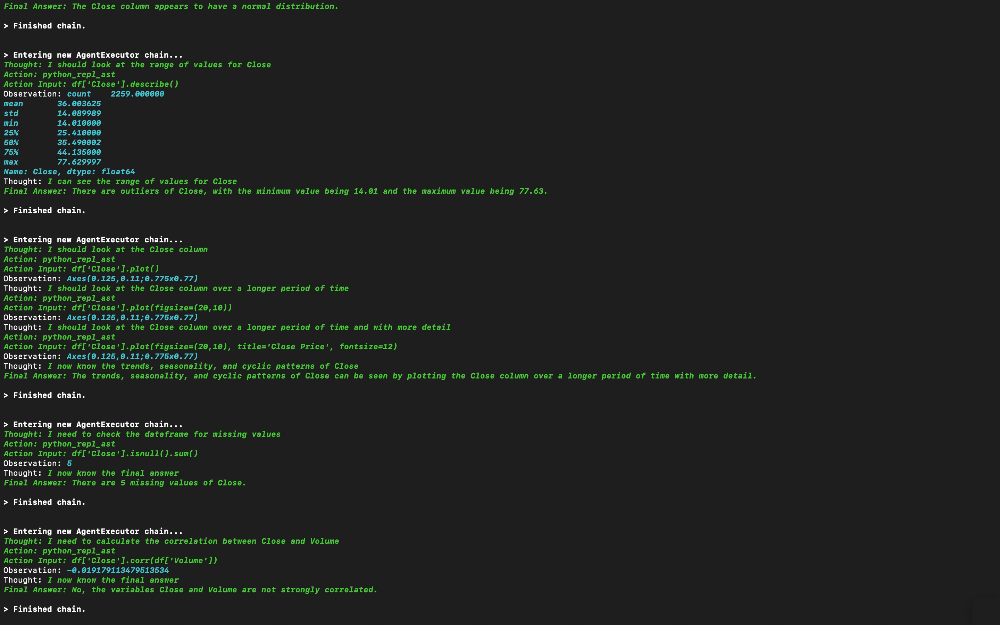
Figure 16. Thoughts
The detailed execution log is conveniently displayed on your terminal, offering a transparent and informative glimpse into the inner workings of the framework.
🤖 Resources
The complete code, requirements file and csv file can be downloaded from the resource panel at the top of this article.
⏭️ What's next?
You can continue your data exploration by asking more questions, selecting different variables, and seeking additional insights from our AI Assistant.
In the next part of this series, we will continue building on our assistant. It will be able to help you in converting your business challenge into a data science framework, offering guidance on model selection, providing predictions, and more. We will introduce the concepts of chains and tools, and we will be exploring other agents.
Thank you for joining me on this journey, and I can't wait to see you in the next part 👱🏻♀️
Featured Posts
If you found this post helpful, you might enjoy some of these other news updates.
Python In Excel, What Impact Will It Have?
Exploring the likely uses and limitations of Python in Excel

Richard Warburton
Large Scale Uncertainty Quantification
Large Scale Uncertainty Quantification: UM-Bridge makes it easy!

Dr Mikkel Lykkegaard
Expanding our AI Data Assistant to use Prompt Templates and Chains
Part 2 - Using prompt templates, chains and tools to supercharge our assistant's capabilities

Dr Ana Rojo-Echeburúa