![[object Object]](/_next/image?url=https%3A%2F%2Fcdn.sanity.io%2Fimages%2Fei1axngy%2Fproduction%2F7f86d50cfa6b3c008eb9be4476c20141663c02ac-500x500.jpg&w=256&q=75)
by Richard Warburton
Updated 9 September 2023
What Does Clean Data Look Like in Microsoft Excel?
![[object Object]](/_next/image?url=https%3A%2F%2Fcdn.sanity.io%2Fimages%2Fei1axngy%2Fproduction%2Ffbbf42373618c164d08cd1d995249cb989c5c85d-1000x562.png&w=2048&q=75)
This tutorial is an extract from our free course, Strategies and Techniques for Data Cleaning in Excel and Python. To access the full course and any downloadable resources, sign up for a free account.
What Is Clean Data?
Clean data is data that does not require any transformation or updates prior to commencing work on analysis. If your data requires cleansing work prior to use, then you have messy data.
If you primarily work with Excel, working with messy data means you regularly find yourself carrying out tasks such as:
- Removing non printable characters such as line breaks.
- Removing leading and trailing spaces or extra spaces.
- Using the text to columns wizard to split data into separate columns.
- Populating blank cells or removing blank rows or columns.
- Identifying duplicate values or duplicate data.
- Using conditional formatting to highlight errors.
- Correcting the capitalisation of text.
- Using paste special to clear formats.
This list is far from exhaustive and messy data is commonplace. Every messy dataset encountered is messy in its own unique way and requires its own unique processes to clean. However, once all such issues are solved and we have clean data, we can progress to the interesting part of the job, the analysis.
Why Does Clean Data in Excel Matter?
Clean data is essential for accurately completing the analysis required.
The process of cleaning data consumes a significant amount of effort. It is estimated that 80% of a data analyst’s time is spent cleaning messy data. As our stakeholders are often only interested in the output analysis, this effort can be viewed as an overhead. It is, however, an essential task. If the data is not in a suitable format to complete the analysis, then we can’t complete it.
It is therefore in our interests to understand what the best practices are for cleaning data and to have a range of tools and techniques in our armory to efficiently clean data when needed.
This naturally poses a question, what does good clean data look like?
Introducing Tidy Data
Understanding the Tidy Data Principals makes the cleansing of data in Excel a much simpler task.
In 2014, a data scientist called Hadley Wickham was pondering the process of cleaning data. He noted that as projects evolved, cleaning activities often needed to be repeated or re-applied to ensure that the required analysis could be completed. Despite the significant effort spent cleaning data, there was little guidance regarding how to best structure data to minimize and simplify such tasks.
This led him to develop the Tidy Data Principals, a simple framework for defining what a good clean data set looks like.
The Tidy Data Principles are highly relevant to analysis work completed in Excel. By applying the principles, you maximize the amount of analysis that can be completed while minimizing the additional work required.
Some Useful Definitions
Before we explore the Tidy Data Principals, we need to cover some definitions:
Observations
An Observation is an individual instance of all the data points that we have collected and are interested in.
For example, we may have collected data on individual people. All the data collected for a specific person would be called an Observation.
Variable
A Variable is a feature we measure for each observation and can vary from one observation to the next.
For example, if we are collecting data on individual people, we may capture their height, age, and place of birth as three separate variables.
Variables are sometimes referred to as Features or Attributes as well.
Value
A Value is the specific measurement recorded for an observation and variable.
For example, if we are collecting data on people, an individual person’s Height being 185cm would be an example of a Value.
Tidy Data Principals
Tidy Data sets out three principles that help us define the optimal structure for capturing clean data.
The Tidy Data principles are:
- Each value is a cell.
- Each variable is a column.
- Each observation is a row.
These principles transcend all data work and are particularly relevant to Excel as we can easily conceptualize and visualize them on spreadsheet grids.
Tidy Data in Practice
Let’s look at how we apply these principles in Excel with an example of transforming a messy data set into a clean and tidy one.
Example Of a Messy Data Set in Microsoft Excel
Consider the following task, we have been asked to analyze exam results across a school. We ask everyone to submit their class marks and we ask one teacher to collate all the results into a single file.
We receive the following back (example limited to first three students' results, the full file can be found in the lesson resources panel)
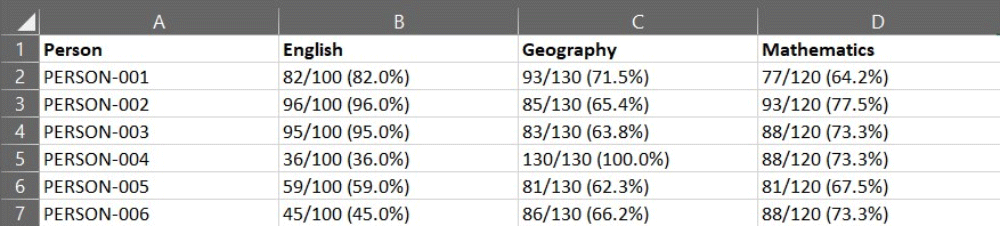
Data collated by a teacher showing exam marks in a messy format
While this captures the exam results, we can quickly see that our options for analyzing this data are limited. For example, you cannot quickly calculate the average mark for each subject.
The full example data set can be found in the lesson resources panel.
To resolve this, we can apply the Tidy Data Principles and re-format how the data is captured.
Each Value Is a Cell.
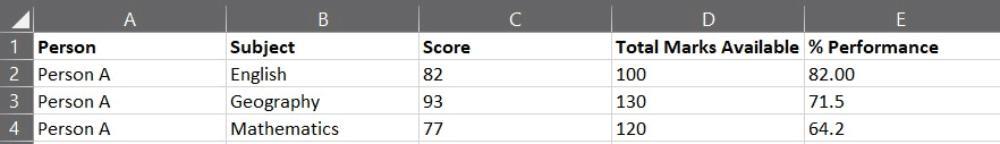
This may sound like a simple statement, but it is quite common to find multiple values within a single cell as is the case here. If we look at an example of a single cell, we can see that it contains three values.
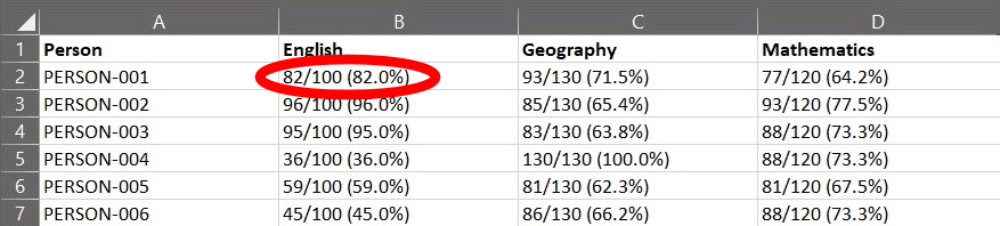
Example of a single cell from the messy exam data
The Exam Mark (82), the Total Marks available (100) and the Percentage Performance (82%). Each of these values should be captured in separate cells.
Each Variable Is a Column.
In exploring the values above, we split the data in one cell into three variables. However, as there are three subjects split across multiple columns of the spreadsheet, it is not totally straight forward to split these values into individual columns representing each variable.
If we were to split each subject response into individual columns, we would have instances of the three variables for each exam subject.
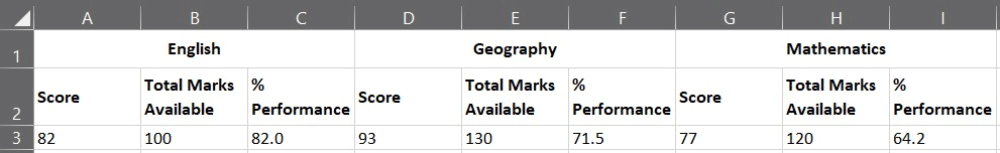
Example of variables stored in columns.
Meaning each variable is in one or more columns. To resolve this, we must reframe how we think about the subjects and think of them as a fourth variable.
By creating a subject column to store this variable we can align the corresponding values in their own columns.
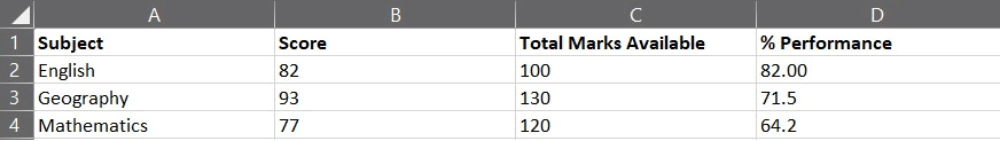
Subject variable as a single column
Each Observation Is a Row.
We can ensure that each row of the data is an observation by recording the correct individual against each row as a variable.
Rows are observation
Individual observations are not always uniquely defined by a single variable. We can see in this example that it is the combination of the individual and the subject variables that define the unique observations.
Example Of Tidy Data in Microsoft Excel
The messy data we were provided with did not enable us to analyze the exam results. By applying the Tidy Data Principles and reformatting how the data is captured, the resultant table is in a format that will allow us to quickly complete any analysis requested from the data.
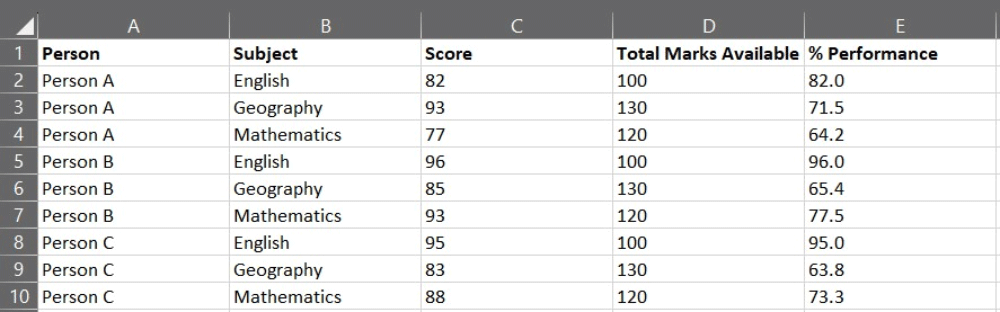
Exam results in a tidy format
How Do I Use Tidy Data in Excel?
By capturing data in a tidy format, we maximize the analysis potential in Excel.
Tidy Data is optimal for use in pivot tables where clean tabular data organized in columns yields the best results. When Tidy Data is used, the aggregation and summarization of data via a pivot table becomes a quick and simple task. Given summarized data, the visualization and production of graphs becomes significantly easier.
Subsets of data can be quickly produced via filtering, meaning relevant parts can be extracted or irrelevant ones discarded. Data can be sorted easily and the top or bottom observations by any given variable can be identified. Finally, data can be transformed and calculations taking one or more variables as inputs can be applied with ease.
How Do You Approach Data Cleaning in Excel.
This article has introduced Tidy Data and provides us with a framework to define what a good clean data format looks like. We have explored this from an Excel perspective and shown that by using the Tidy Data Principles, you put yourself in the best possible position for completing any requested analysis.
The good news is that these principles extend far past the capabilities of Excel and are highly relevant and beneficial in all data work.
The same is true of the tools and techniques needed to clean data effectively. We can learn about these in the familiar Excel environment and in doing so, gain knowledge that has a much wider application. This knowledge is particularly relevant if you are aspiring to a career in machine learning and using other data analytics tools.
Our next article in this series helps you on this journey and demonstrates how to supercharge your Excel data cleaning by using Python
Featured Posts
If you found this post helpful, you might enjoy some of these other news updates.
Python In Excel, What Impact Will It Have?
Exploring the likely uses and limitations of Python in Excel

Richard Warburton
Large Scale Uncertainty Quantification
Large Scale Uncertainty Quantification: UM-Bridge makes it easy!

Dr Mikkel Lykkegaard
Expanding our AI Data Assistant to use Prompt Templates and Chains
Part 2 - Using prompt templates, chains and tools to supercharge our assistant's capabilities

Dr Ana Rojo-Echeburúa