![[object Object]](/_next/image?url=https%3A%2F%2Fcdn.sanity.io%2Fimages%2Fei1axngy%2Fproduction%2Fcc5ab2d63daeea476490218d4e41b58074e8d535-2147x2147.jpg&w=256&q=75)
by Dr Alexander Mead
Updated 7 June 2023
twinLab Case Study: Emulating Cosmological Structure with twinLab
![[object Object]](/_next/image?url=https%3A%2F%2Fcdn.sanity.io%2Fimages%2Fei1axngy%2Fproduction%2Fdf9b2603943627d905c3d4e013242c6a71959f1f-800x448.jpg&w=2048&q=75)
Cosmological structure
In this article, we will explore how twinLab can be used to create an emulator for the statistical properties of structure in the universe. This emulator can then be used to generate mock maps of the matter distribution across vast regions of space. This reduces the need for computationally expensive -body simulations, by replacing their output with something that can be generated with a trained twinLab statistical model.
Introduction
The large-scale distribution of billions of galaxies contains a wealth of information about the origin, expansion, and contents of the Universe. For example, the galaxy distribution is sensitive to the amounts of dark energy and dark matter, the current and historial expansion speed, and the process of inflation that occurred soon after the big bang and which seeded the diverse array of cosmological structure, including all galaxies, stars and planets, that we see today.
Galaxies exist in dense clumps, called groups, clusters, super clusters, depending on the number, at the nodes of the density distribution. It follows that by measuring with distribution of galaxies we can infer things about the fundamental make-up of the cosmos.
The underlying density structure is governed by the dynamics and properties of dark matter, which defines a skeleton along which gas can flow and clump. This gas eventually cools through radiative processes, which allows it to contract and eventually form galaxies and stars.
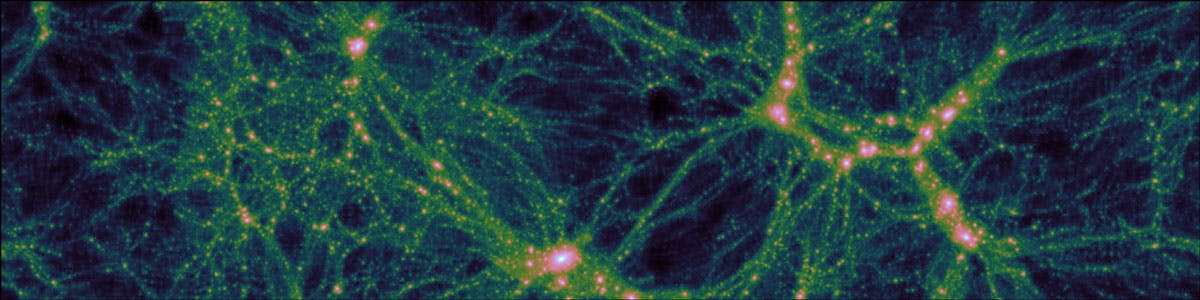
Fig. 1. A slice through an N-body simulation, 50 Mpc across, which would take light 150 million years to cross. The most intense blobs shown are vast dark-matter haloes that contain a galaxy cluster; many thousands of galaxies that orbit each other
Fig. 1 shows a slice through an -body simulation. The dense regions are aggregations of dark matter that would contain many hundreds or even thousands of galaxies. High-resolution simulations such as this are expensive to run, taking many weeks to run on the largest super computers in the world.
For each simulation, a distinct choice must be made about the underlying parameters of the universe being simulated, for example, one must choose the amount of dark matter and dark energy, the expansion speed, and properties of the primordial matter distribution.
Power spectrum
To extract cosmological information from the galaxy distribution requires precise models of the statistical properties of the distribution as a function of the underlying parameters. Analytical linear theories, developed over the last 30 years, work at early times in the history of the Universe and on extremely large scales, where perturbations to the mean density are small. However, on the (comparatively small) scale of galaxies, the perturbations are huge, and modelling their distribution can only be accurately achieved using expensive -body simulations.
It is impractical to run accurate simulations at all points in parameter space, especially since the space of models under investigation is ever expanding. In modern cosmology, this includes the space of exotic dark energy models, beyond-Einstein gravity theories, and non-standard particle physics models for dark matter and neutrinos.
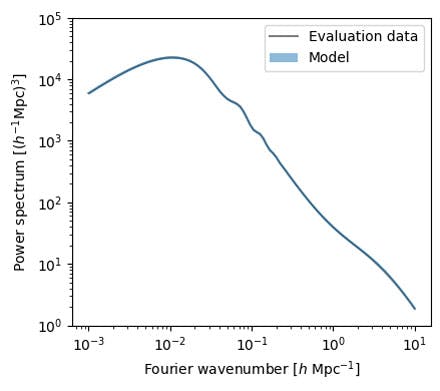
Fig. 2. An example matter power spectrum for a specific set of cosmological parameters. The slope at low wave-numbers is determined by the mechanism of inflation in the first moments of time after the big bang. The location of the main peak is determined by the relative amount of matter and light in the early Universe. The 'wiggle' at slightly higher wave-number encodes information about the passage of sound waves in the primordial plasma. Finally, the bump at the highest wave-numbers shown is caused by the development of galaxies and the dark-matter haloes that surround them
Emulation
In this example, we use twinLab to create an emulator for the matter power spectrum, a statistical quantity that contains (a large subset of) the information from the clustering distribution of galaxies. The power spectrum can both be computed via simulation and also measured in observational datasets. An example power spectrum for a specific set of cosmological parameters is shown in Fig. 2, where the data and model overlap very well (almost perfectly).
The training of the twinLab emulator is performed online (in the cloud) and is completed in a matter of minutes.
Once trained, the emulator can be used for extremely rapid power-spectrum evaluation across parameter space in a way that interpolates and extrapolates reasonably. The major benefit of using twinLab is that we get an accurate estimate of our model uncertainty for free, so that we know exactly how much we should trust our trained surrogate model.
In this example, the model is trained on approximate simulation data that occupy a Latin-hypercube distribution across five parameters of interest to cosmologists. The model can be rapidly retrained if necessary, and additional parameters can be incorporated. In this way, we can test emulator construction as a function of underlying cosmological parameters, and we can learn how many simulations might be required in future simulation campaigns to get a reasonable distribution of simulations across the full parameter space.
Using twinLab, we train a functional Gaussian Process to act as a surrogate model for the power spectrum.
We specify five cosmological parameters as inputs (in that, we wish to create an emulator for the power spectrum as a function of these 5 parameters) and output the power spectrum at some pre-determined wave-numbers. The data-points that comprise a smooth function are obviously very strongly correlated, because the value of the power at each wave-number depends very strongly on the value of the power at neighbouring wave-numbers.
A functional Gaussian Process decomposes the set of training data into a set of basis functions that is determined by the data themselves. The sum of these functions then capture the overall shapes of all possible power spectra, and the exact coefficients used in the sum are then the numbers that are learned (as a function of cosmological parameters inputs) when the Gaussian Process is trained.
# Upload the dataset to the twinLab cloud
dataset = 'resources/datasets/cosmo.csv'
tl.upload_dataset(dataset)

# Parameter specification for twinLab
params = {
    "dataset": dataset,
    "inputs": ["Omega_c", "Omega_b", "h", "ns", "w0"],
    "outputs": [f"k{i}" for i in range(128)],
    "decompose_outputs": True,
    "output_explained_variance": 0.999,
}

# Train the emulator!
tl.train_campaign(params, CAMPAIGN_ID)
The above code snippet shows how easy it is to create an emulator using twinLab. The dataset cosmo.csv contains the power spectrum for 100 different cosmological models, together with the cosmological parameters used to generate those spectra; we upload that dataset to the twinLab cloud.
Next, we create a parameters dictionary to specify how we want to train our emulator. We specify: the dataset; those list of columns of cosmo.csv that we want to use as inputs for the emulator (in this case ["Omega_c", "Omega_b", "h", "ns", "w0"]); the output columns (here the columns that contain the power measured at different wavenumbers k). In this case we are training a functional Gaussian Process (indicated to twinLab via the decompose_outputs key) to model the power spectrum function (e.g., Fig. 2), so we specify how much of the power spectrum we are comfortable with knowing (99.9% will contain most of the information).
Results
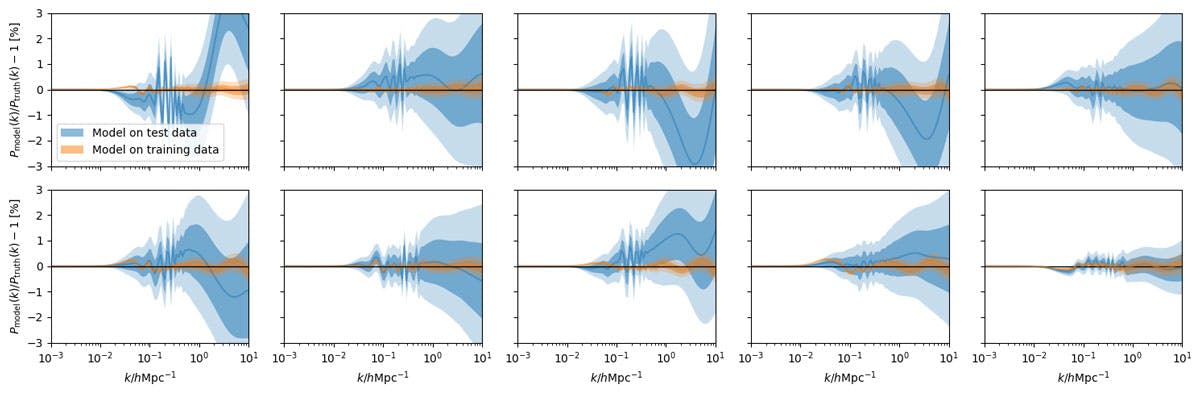
Fig. 3. The performance of the surrogate model on training data (orange) and on unseen test data (blue) for 10 independent examples of each. We see that the emulator achieves an accuracy of a few percent on unseen model examples across a range of wavenumbers (k on the x-axis here)
Fig. 3 shows the performance of the surrogate model on training data (orange) and on unseen test data (blue) for 10 independent examples of each. The target of interest is the ratio of the model prediction to the "truth", across a range of Fourier wave-numbers, which we can compute exactly in this case.
We see that the predictions are generally excellent on the training data. On the test data, we still see good performance, but the error creeps up to around a few per-cent for some sets of cosmological parameters. We also see that the emulator-predicted error is a good indication of actual uncertainty (i.e., the model error is larger when the model is more wrong). The error-bound can therefore be taken to be a conservative estimate of the error inherent in the emulator. This could be decreased by providing more training examples for the emulator, which would also be necessary if the model were to be expanded to a larger set of cosmological parameters.
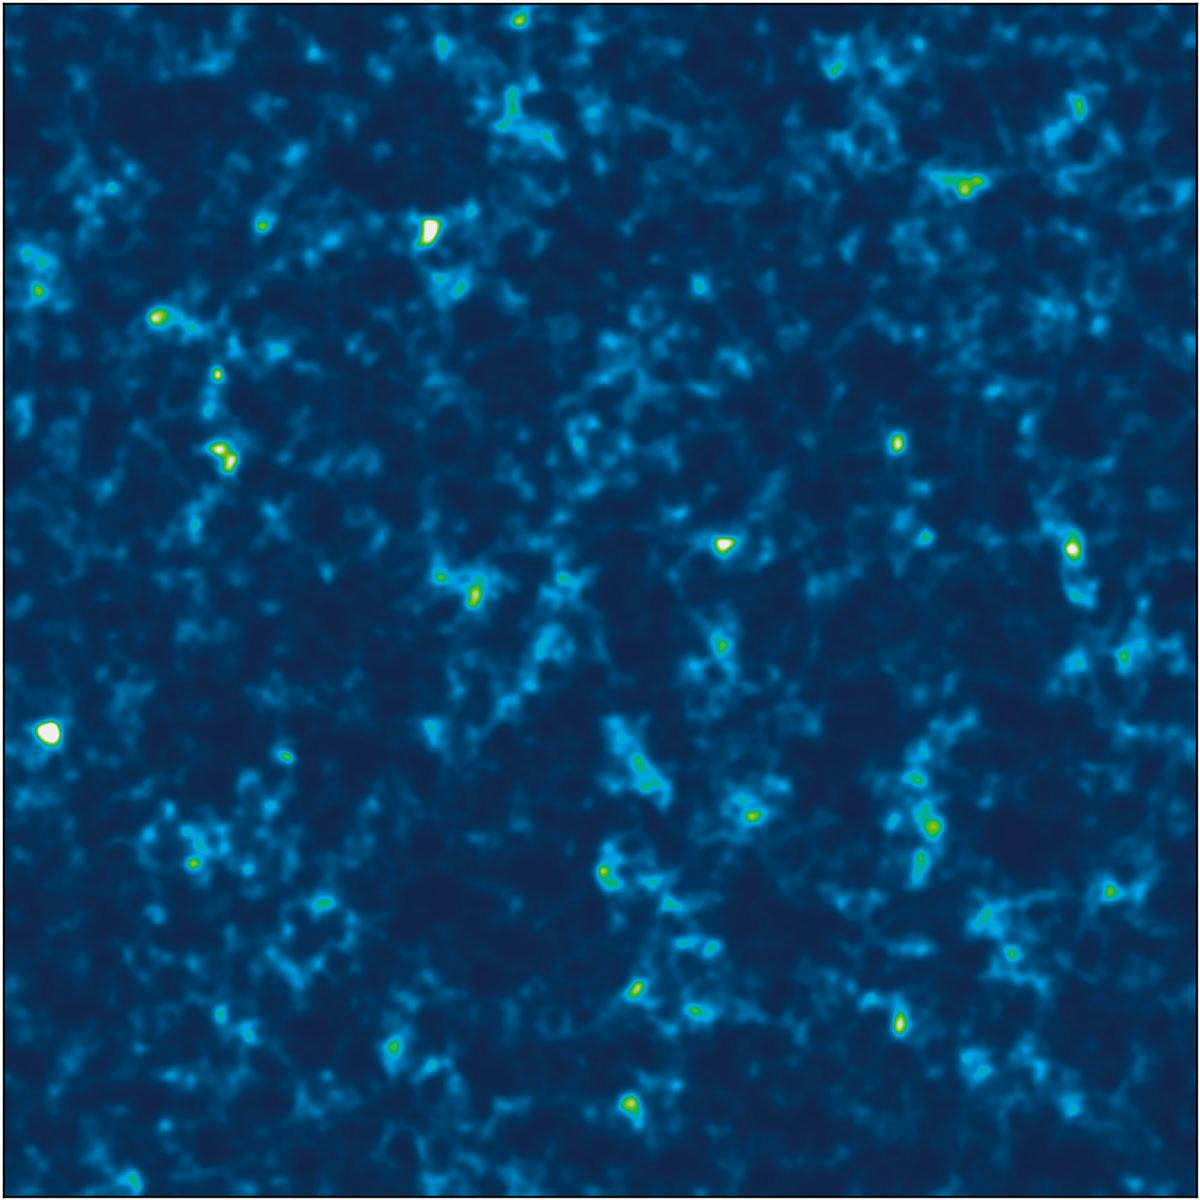
Fig. 4. A mock density field constructed using the output from the emulator. The resolution is low compared to the N-body image shown above, but maps like this can be created in a few seconds on a standard laptop using twinLab, which compares to hundreds of computer-hours needed for a medium-resolution simulation
Fig. 4 shows a mock density field constructed using the output from the emulator, which takes a few seconds to generate. The region of the Universe shown is 500 megaparsecs across and one megaparsec deep, which would contain approximately 250,000 galaxies and would take light more than 1.5 billion years to cross.
Galaxies are clustered into huge superclusters, which are joined by filaments and separated by voids. Clearly the image is of low-resolution compared to the full simulation, but huge numbers of low-resolution mock universes such as these are useful for understanding the statistical correlations present in the Universe as a function of the underlying parameters.
Get the code
The completed notebook for this example can be downloaded from GitHub where the emulator for the power spectrum can be trained, and even modified if desired (maybe you can come up with a better one!). Mock universes can be generated here.
Want to deploy twinLab on your own projects?
twinLab's public API is launching soon - giving you the power to build your own emulators.
Featured Posts
If you found this post helpful, you might enjoy some of these other news updates.
Python In Excel, What Impact Will It Have?
Exploring the likely uses and limitations of Python in Excel

Richard Warburton
Large Scale Uncertainty Quantification
Large Scale Uncertainty Quantification: UM-Bridge makes it easy!

Dr Mikkel Lykkegaard
Expanding our AI Data Assistant to use Prompt Templates and Chains
Part 2 - Using prompt templates, chains and tools to supercharge our assistant's capabilities

Dr Ana Rojo-Echeburúa