![[object Object]](/_next/image?url=https%3A%2F%2Fcdn.sanity.io%2Fimages%2Fei1axngy%2Fproduction%2F7f86d50cfa6b3c008eb9be4476c20141663c02ac-500x500.jpg&w=256&q=75)
by Richard Warburton
Updated 11 September 2023
How to Clean Data in Excel Using Python: The Basics
![[object Object]](/_next/image?url=https%3A%2F%2Fcdn.sanity.io%2Fimages%2Fei1axngy%2Fproduction%2Fd2facf19275d9deb2d9a85029ab18bdafdb65840-1000x564.png&w=2048&q=75)
This tutorial is an extract from our free course, Strategies and Techniques for Data Cleaning in Excel and Python. To access the full course and any downloadable resources, sign up for a free account.
Why Use Python to Clean Data in Microsoft Excel?
In the last article, Supercharge your Excel data cleaning with Python!, we explained how using Python to clean Excel data not only provides us with all the cleaning functionality of Excel and Power Query, but it also opens up a whole new set of useful data tools and features. While there is a learning curve for Python, the skills you learn and the knowledge you gain will future proof your career.
Advanced Data Cleaning in Excel
We all start out manually cleaning data in Excel. In doing this, we become familiar with the features and formulas that enable us to complete tasks. These can be easily replicated in a few lines of code in Python.
Such features and functions include:
- Splitting columns into multiple variables via text to columns.
- Applying formulas to multiple variables in the data to create new ones.
- Looking up values from other data sources via VLOOKUP.
- Removing duplicate data values.
- Formatting text strings to show the correct capitalization.
In this article, we will be demonstrating the Python equivalents of these and applying them in an example.
Example: Cleaning Messy Order Data
Let’s expand on the example from the previous article. The orders database contains more information than previously analysed. The database also contains:
- The name of the client contact placing the order.
- The address of the client
In a separate Company Details table, we also have:
- The customer names (and not just a customer number)
- The sales representative for each customer.
The Requested Analysis
The increased availability of data means that we can produce more useful data analytics for the business, and they have expanded their ask as a result.
We have been asked to:
-
Provide a breakdown of total order numbers (volume and value) by:
- Customer Name (Not number)
- Sales Rep Name
- Country
-
Isolate the name of the person raising the order and each individual element of the address as separate variables so that shipping labels can be printed.
Messy Data Extracted from Order System
We experience the same issue as before. When we extract the data from the order system and copy it into Excel it is messy!
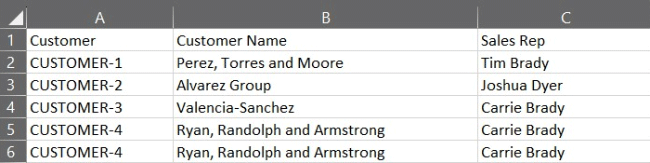
Example Of Messy Order Data in Excel:
Messy order data
Example Of Messy Customer Details in Excel:
Customer details
(NOTE: This is fabricated data, created using the Faker module, any similarity to existing people or entities is coincidental)
Data files and supporting code and notebooks can be downloaded from the lesson resource panel
Why Is This Messy?
This data is messy as we cannot complete the requested tasks without carrying out cleaning activities. Using the Tidy Data Principles as a guide, we can inspect the data and identify the issues we need to clean.
Tidy Data Principal 1: Each Value is a Cell
We have the same issues as before, the Price Per Unit variable is not a clean numeric value, limiting the production of the requested analysis.
Tidy Data Principal 2: Each Variable is a Column
For the analysis requested, we have multiple variables within a column. As we have been asked to split the address into individual elements and provide analysis by country, we will need to split this column into individual address element variables.
We also need to generate new variables for the data. The name of the person raising the order is something we can parse from the Order Email and the Total Order Value is something we can calculate from the product of the Units Ordered and the Price Per Unit. As variables, these will need their own columns.
Tidy Data Principal 3: Each Observation is a Row
Tidy data requires rows to be single observational units. In the Order Data, a row corresponds to an order, and in the Customer Details, a customer. We will need to merge the data into a single table where an order is the observational unit, and the properties of the customer are a variable for this observation.
Data Cleaning Approach
Having identified the issues to resolve, we can devise a plan for cleaning the data. This is as follows:
- Implement data cleaning from the last article to ensure Price Per Unit is a numeric value.
- Apply a formula to calculate the Total Order Value per order.
- Isolate the individual elements of the address and store them as separate variables.
- Extract the name of the ordering individual from the order email and copy it into a new variable.
- Correct the capitalization of the text values extracted.
- Check for duplicates and remove any that are found.
- Look up the company name and sales representative from the Company Details table.
Step 6 is not something that may be obvious from our initial investigations. As we work through this exercise, we will explain why it is beneficial to check for duplicates prior to looking up values in Python.
Step 1: Import Data & Cleaning Price Per Unit Value
See the previous articlefor an overview of importing data and how to find and replace data values.
Step 2: Calculating the Total Order Value
This transformation requires us to produce a new variable by applying a formula to two existing ones.
Pandas provides us with a simple way to apply formulas to data series that have the same shape (in Excel speak, columns of data that have the same number of rows populated). We can apply the mathematical operations we want directly to the columns. As the number of elements in each series is the same, Pandas knows to apply the function to corresponding values of the same index.
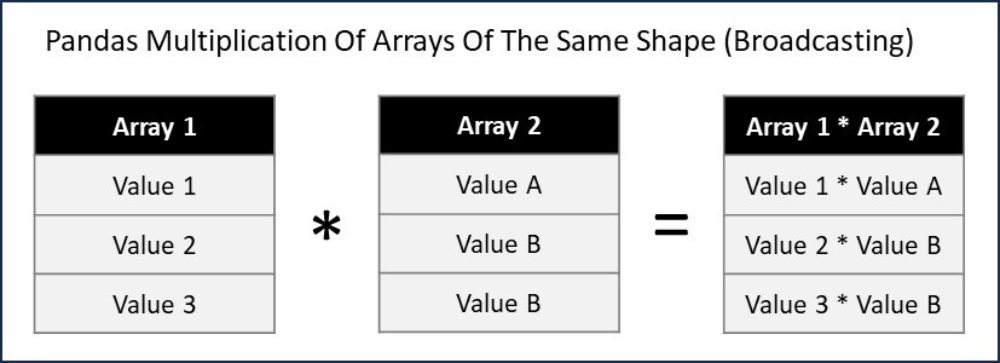
Broadcasting in Pandas
Pandas does not always behave like this. If the arrays (another way to refer to Pandas data series) that are being multiplied are of differing shapes, then Pandas will adjust how the calculation is performed.
The process of determining how Pandas treats arrays of differing shapes and sizes when mathematical operations are applied is called broadcasting. How Pandas broadcasts in differing circumstances and why it does this are above the scope of this article. Further details can be found here.
This means we can calculate the total order value per line by implementing the following code:
# Calculate Total Order Value
messy_data['Total Order Value (£s)'] = messy_data['Units Ordered'] *  messy_data['Price Per Unit (£s)']
Reviewing the output of this we can see this has carried out the expected calculations.
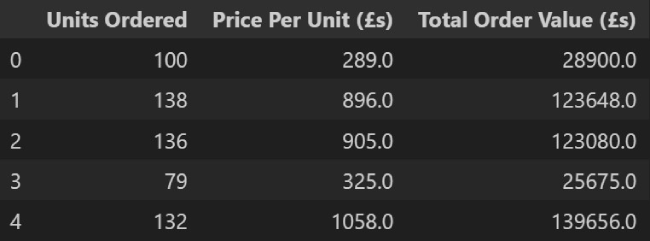
Python output
Step 3: Splitting Client Address Column into Multiple Variables
The text to columns wizard is a very useful feature in Excel. It allows us to separate a single column of text values into multiple ones, based on a delimiter (often a comma) signifying a separation. The Pandas function str.split carries out the same transformation in Python. We can use this here to separate the address into separate variables.
When you inspect the imported data in Python, you will notice that it differs from the data in Excel.
Imported Client Addresses in Python
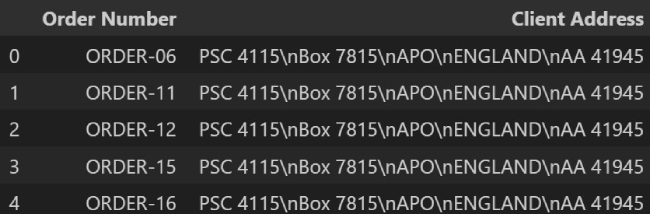
Raw data imported to Python
Client Addresses in Excel
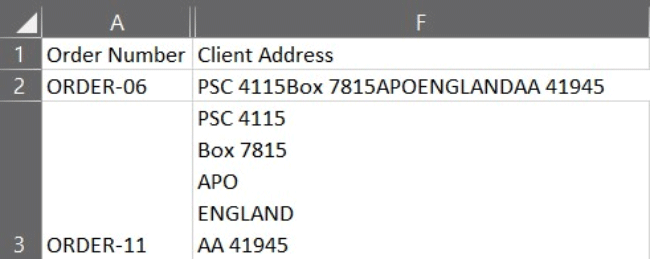
Raw data in Excel
The data in Excel either appears on one line (see cell F2) or, if the cell has been selected at any point, on individual lines (see cell F3). In Python, it appears as a single string with ‘\n’ between each element.
This is an example of a non-printable character and in Excel (and other text interpreters) a ‘\n’ signifies a new line. This is why the data splits into multiple lines when we select the individual cells. As it is nonprintable, we would not see it in the cells either before or after selection.
In some cases, we may want to remove such characters, however, in this situation, we can use it as a delimiter to split the cell into multiple columns.
Noting that the data is in the same format for all values, (Street / Box Number / Country / Mail Code), the following code will split the data and return individual variables for each element.
# Define a list of new variable names for the seperated data from the Client Address
address_details = ['Street','Box','County','Country','Mail Code']

# Split Client Data in to seperate columns and assign to the columns named in the list address_details
messy_data[address_details] = messy_data['Client Address'].str.split('\n',expand=True)

# Remove the original Client Address variable from the data
messy_data = messy_data.drop(['Client Address'],axis=1)
This creates four new variables in the messy_data dataframe (with the names set out in the address_details list) and extracts them from the ‘Client Address’ variable by applying the str.split function outlined above. The setting of the variable expand=True ensures that the extracted variables are returned in their own columns.
As we have duplicated the data from the Client Address in the new individual variables, we can now drop the original data from the messy_data dataframe. The last line of code does this for us and the variable axis = 1, tells the drop function we are looking to drop a column.
Step 4: Extract the Name of The Ordering Individual
Using ‘@’ as a delimiter, we can adapt the technique applied in step 3 to extract an order name from the email address.
We will need to isolate the first column only (i.e. that containing the name.surname), and then replace the ‘.’ With a space so that we have a correctly formatted name.
In code, this looks like this:
# Extract the first name and last name from the Order Email and add to messy_data
messy_data['Order Name'] = messy_data['Order Email'].str.split('@',expand=True)[0].str.replace('.',' ')
The [0] in the middle of the code, limits the first application of the split function to return just the zeroth indexed column (That is the first column of name.surname, remember python indexes from zero).
Step 5: Correcting the Capitalization of Text
Having completed the previous steps, we can see that there are two variables that are fully capitalized.
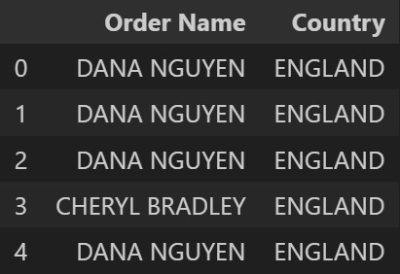
Fully capitalised values
As they contain proper nouns, we want to capitalize the first letter of them only. This is something that in Excel can be completed with the use PROPER functions.
Again we see that Python and Pandas have an equivalent function, the str.title function.
This can be implemented using the following code:
# Update the Country variable to be a title case (i.e. capitalise the first letter of each word)
messy_data['Country'] = messy_data['Country'].str.title()

# Update the Order Name variable to be a title case
messy_data['Order Name'] = messy_data['Order Name'].str.title()
Step 6: Identifying and Removing Duplicate Rows of Data
The final task we wish to complete (step 7) involves looking up the values contained within the companies’ data file.
If we import this into Python as company_data and view it, we can very quickly see that there are duplicate values in this data set.
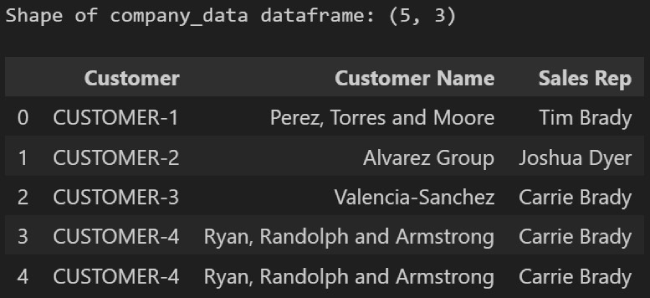
Customer_data shape and duplicate row
A wizard in Excel allows duplicates to be identified and removed very efficiently. It is also worth noting that duplicates in an Excel VLOOKUP call are not necessarily an issue as it will return the first value it finds. However, when implementing the equivalent functionality in Python and Pandas, it can introduce a problem, it can create duplicates (something we will explain in Step 7).
The Pandas function drop_duplicates provides a quick way to remove these from our dataframe. The function is quite versatile and can be applied in many ways.
# Remove duplicate rows from the company_data dataframe
company_data = company_data.drop_duplicates()
By default, drop_duplicates will keep the first instance of a duplicate it finds and drop the rest (Hence row 3 being kept in the data below)

Customer_data shape post removal of duplicate row
Step 7: Looking Up Values
The process of looking values up in Excel is carried out with a VLOOKUP or an INDEX and MATCH formula.
Pandas provides similar functionality for Python via the merge function. The behaviour of this function is based on a database join between two tables (the ‘Left table and the ‘Right table’) and in specific circumstances, will behave in the same way as a VLOOKUP.
Understanding how a database joins data allows us to change the behavior of the merge function. An overview of this can be found here. By default, the merge function applies an inner join.
In our example, we have our left table (the messy_data) and we want to look up the values from the right table (the company_data) via a match in values of the Customer ID (the ON value for the join)
If we have a many-to-one relationship between the left and right tables (that is many instances of the look-up ‘on’ variable values in the left table, but only one instance in the right table values) then the default merge will behave in the same way as a VLOOKUP.
If there are duplicates in the right table, it will permute and return all possible permutations of lookups. This will introduce duplicates into the resulting dataframe, something that depending on the ask may or may not be desirable. We need to be careful with the application of the merge function and check the shape of the dataframes both before and after.
Having identified and removed the duplicates from the company_data dataframe in step 6 (the right table in the join), duplicates are not to be expected. We will however verify this in the code.
The code to implement the desired look-up and checks are as follows:
# Print the shape of the messy_data dataframe to the screen prior to merge
print('Shape of messy_data prior to merge:', messy_data.shape)

# Merge data sets and lookup values in the messy_data and customer_data via an Inner Join on the 'Customer' variable
clean_data = messy_data.merge(company_data, on = 'Customer')

# Print the shape of the meesy_data dataframe to the screen prior to merge
print('Shape of clean_data post merge:', clean_data.shape)
Reviewing the shape of the dataframes before and after the merge indicates that the only change is the addition of two new columns.

Shape of messy_data pre and post mergeheight78
As this is our last cleaning step, the code assigns the result to a new variable, clean_data, and exports it to Excel.
We are now able to complete the requested analysis. An example of this is provided in the supporting code folder for this article.
Next Steps: Advanced Techniques to Learn
This article has explored and demonstrated how Python can replicate the same functionality as Excel with a few lines of code. The functionality of Python extends past the capability of Excel and provides us with a new set of tools that have previously been inaccessible.
In an upcoming article, we will explore one such example and demonstrate how email addresses and phone numbers can be extracted from free text responses in data.
Featured Posts
If you found this post helpful, you might enjoy some of these other news updates.
Python In Excel, What Impact Will It Have?
Exploring the likely uses and limitations of Python in Excel

Richard Warburton
Large Scale Uncertainty Quantification
Large Scale Uncertainty Quantification: UM-Bridge makes it easy!

Dr Mikkel Lykkegaard
Expanding our AI Data Assistant to use Prompt Templates and Chains
Part 2 - Using prompt templates, chains and tools to supercharge our assistant's capabilities

Dr Ana Rojo-Echeburúa